Author : Sristhi
Machine Learning is the type of artificial intelligence that learns as it identifies new patterns in data. Machine-learning algorithms are responsible for the vast majority of the artificial intelligence advancements and applications. Machine-learning algorithms use statistics to find patterns in massive amounts of data.

Linear Regression
Linear Regression is a commonly used supervised Machine Learning algorithm that predicts continuous values. It assumes that there is a linear relationship present between dependent and independent variables. Regression models are target prediction value based on independent variables.
Linear Regression is the basic form of regression analysis. It is based on supervised machine learning. It assumes that there is a linear relationship between the dependent variable and the predictor(s). Main target of this algorithm is to find prediction on the based of independent variables.
y=mx+c .
where m is slope,
x is independent variable ,
y is dependent variable
c is intercept.
It is a statistical method that is used for predictive analysis. Linear regression makes predictions for continuous or numeric variablesHere we use,
from sklearn.linear_model import LinearRegression
Figure 1 Linear Regression
Dependent variable is salary.
Independent variable (predictor variable) is Years of Experience.
MULTIVARIATE REGRESSION ANALYSIS
There are many situations where many independent variables are effected by other variables for that we have to move to different option than a single regression model that can only take one independent variable. Multivariate Regression is a type of machine learning algorithm that involves multiple data variables for analysis. It is mostly considered as a supervised machine learning algorithm. It helps to find the correlation between the dependent and multiple independent variables.
Multivariate regression is a simple extension of multiple regression.
Example : A normal person wants to take loan from bank than a bank staff wants biodata of person such as land area, history of his/her account, mobile number , age etc. than find a relation between these variables.
Solution
Selecting the features: Finding which variable is dependent on this feature.
Normalizing features: The features are then scaled in order to bring them in to make better analysis. We can also change the value of each feature.
Selecting Hypothesis and Cost function: Hypothesis means predicted value from the feature variable. Cost function defines the cost for wrongly predicting hypothesis. It should be as small as possible.
Minimizing the cost function: Minimizing the cost by Gradient descent algorithm and use it over the datasets which can help to adjust the hypothesis parameters. Once the cost is minimized then it can be used for prediction.
LOGISTIC REGRESSION
Logistic regression models the probabilities for classification problems with two possible outcomes (0 OR 1). It's an extension of the linear regression model for classification problems.The linear regression model can work good for regression, but fails for classification. In case of two classes, you could label one of the classes with 0 and the other with 1 and use linear regression. Technically it works and most linear model programs will spit out weights for you. But there are a few problems with this approach.
A linear model does not output probabilities, but it treats the classes as numbers (0 and 1). So it simply interpolates between the points, and you cannot interpret it as probabilities. A solution for classification is logistic regression. It is basically a supervised classification algorithm.
In a classification problem, the target variable (or output), y, can take only discrete values for given set of features(or inputs), X. Instead of fitting a straight line or hyperplane, the logistic regression model uses the logistic function to squeeze the output of a linear equation between 0 and 1.
The logistic function, also called the sigmoid function .
1 / (1 + e^-X)
Example: Fraud detection, Disease diagnosis, Emergency detection, Spam detection etc.

Figure 2 Linear Regression vs Logistic Regression
DECISION TREE
Decision Tree is a Supervised learning technique that can be used for both a classification problem as well as for regression problem. It is a tree-structured classifier.
The goal of this algorithm is to create a model that predicts the value of a target variable, for which the decision tree uses the tree representation to solve the problem in which the leaf node corresponds to a class label and attributes are represented on the internal node of the tree. The decisions or the test are performed on the basis of features of the given dateset. It is called a decision tree because, similar to a tree, A decision tree simply asks a question, and based on the answer (Yes/No), it further split the tree into sub trees. Decision node is further branched but leaf node is not.

Figure 3 Decision Tree
SUPPORT VECTOR MACHINE
SVM is a type of learning lies in the Supervised Learning which is associated with classification and regression. Basically, SVM finds a hyper-plane that creates a boundary between the types of data. In 2-dimensional space, this hyper-plane is nothing but a line. As it consists of supervised learning so in this we have labelled data to deal with model training.

Figure 4 - SVM
Model training: we have to give the data to model training because we have to build the model.
Prediction: when data is trained we have to send it to the further step for the testing in which it predict the value.
New data: whether the testing phase data is quadrilateral or circle class classification.
Output: if your model is accurate by the predicted data then output will be:
The new data is quadrilateral class.
The new data is circle class.
NAÏVE BAYES
Naïve Bayes is supervised learning algorithm and used for solving classification problem. it helps the building the fast machine learning model which make quick prediction.
Naive: It is called Naïve because it assumes that the occurrence of a certain feature is independent of the occurrence of other features. Such as if the laptop is identified on the bases of memory space, core, and battery duration, screen size and best laptop is recognized as an Lenovo. Hence each feature individually contributes to identify that it is a laptop without depending on each other.
Bayes: It is called Bayes because it depends on the principle of Bayes' Theorem.
The formula for Bayes' theorem is given as:

P(A|B) is the posterior probability of class (A, target) given predictor (B, attributes).
P(A) is the prior probability of class.
P(B|A) is the likelihood which is the probability of predictor given class.
P(B) is the prior probability of predictor.
Example: weather condition is given we have to decide we will go outside for playing or not.
K-NEAREST NEIGHBOR ALGORITHM
K-nearest neighbors (KNN) algorithm is a type of supervised ML algorithm which can be used for both classification as well as regression predictive problems. However, it is mainly used for classification predictive problems in industry. K-NN is a non-parametric algorithm, which means it does not make any assumption on underlying data.It is also called a lazy learner algorithm because it does not learn from the training set immediately instead it stores the dataset and at the time of classification, it performs an action on the dataset.
Suppose there are two categories, i.e., Category A and Category B, and we have a new data point x1, so this data point will lie in which of these categories. To solve this type of problem, we need a K-NN algorithm. With the help of K-NN, we can easily identify the category or class of a particular dataset. Consider the below diagram:

Figure 5 - KNN
K-MEANS CLUSTERING ALGORITHM
K-means clustering is an unsupervised learning algorithm that is used to solve the clustering problems in ML. It groups the unlabeled dataset into different clusters.
Here, k defies the number of pre-defined clusters that need to be created in the process.
As if k=2,there will be 2 clusters.
If k=3,there will be 3 clusters and so on.
It mainly performs to task:
Determines the best value for K-center points or centroids by an iterative process.
Assigns each data point to its closest K-center those data points which are near to the particular K-center ,create a cluster.
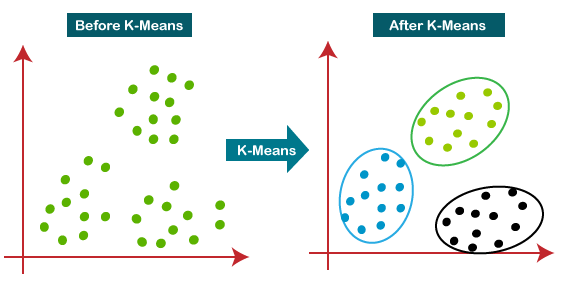
Figure 6 - K-Means Clustering
Steps for K-Means Clustering
Step-1: Select the number K to decide the number of clusters.
Step-2: Select random K points or centroids.
Step-3: Assign each data point to their closest centroid, which will form the
predefined K clusters.
Step-4: Calculate the variance and place a new centroid of each cluster.
Step-5: Repeat the third steps, which means reassign each data-point to the
new closest centroid of each cluster.
Step-6: If any reassignment occurs, then go to step-4 else go to finish.
Reference:
https://www.technologyreview.com/2018/11/17/103781/what-is-machine-learning-we-drew-you-another-flowchart/
https://www.thermofisher.com/blog/connectedlab/machine-learning-a-primer-to-laboratory-applications/
https://www.javatpoint.com/k-nearest-neighbor-algorithm-for-machine-learning
Comments