Author- Namarta Gocher
Malaria is a blood disease caused by a parasite called plasmodium; transmitted from humans by the female Anopheles mosquito. Different malaria symptoms help us to predict that a person is suffering from malaria. In 2019, there are a total of 409,000 deaths in the world are due to malaria, so it is very important to the prognosis, it is an efficient and effective way.

FIG:1

FIG:2
It has 1000 rows of data and 19 columns, which are age, sex, fever, cold, rigor, fatigue, headache, bitter tongue, vomiting, diarrhea, Convulsion, Anemia, jaundice, cocacola urine, hypoglycemia, prostration, hyperpyrexia, severe malaria. We will be using KNN, DECISION TREE, LOGISTIC REGRESSION, and SVM for classifying the result. Then we will compare all the results given by these algorithms. First, we will convert the data set in 0 or 1 to fit for the classification and then predict.
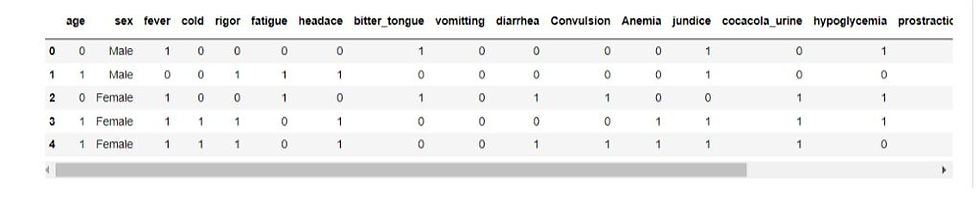
FIG:3

FIG:4
After KNN training:

FIG:5
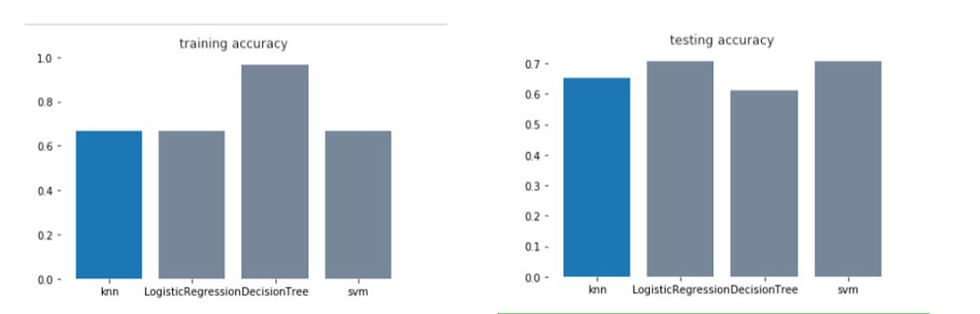
Now calculating all the training and testing scores by comparing KNN, DECISION TREE, LOGISTIC REGRESSION, SVM based on training and testing scores we get:
FIG;6
All four algorithms are supervised machine learning algorithms.
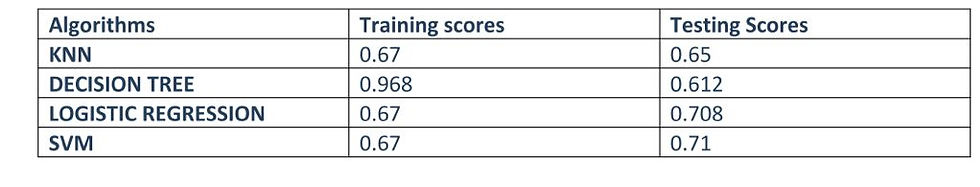
FIG:7
Flow Chart:

FIG:8
K-Nearest Neighbor(KNN)
KNN is a nonparametric, lazy learning algorithm. Its purpose is to use a database with the data points, divided into the number of classes to predict the classification from the point of view of a specimen.
The steps for the calculation of the K-nearest neighbors:
Set the parameter K= number of nearest neighbors.
To calculate the distance between the study and all of the training samples.
The sort of distance, and defined, the nearest neighbors based on the Kth minimum distance.
Collect the category of the y-nearest neighbors
The use of a simple majority of the categories, of which the nearest neighbors, the forecasted value of the query instance.
DECISION TREE
A decision tree is similar to that of a flow chart: each internal node represents a "test" as an attribute (for example, if a flip was heads or tails), each case is the result of the test, and in each of the last node, the node labels in a class, if a decision is taken, after that take into consideration all of the attributes).
There are some impurity measure are there like
Entropy
Gini index/ Gini impurity
Entropy
Entropy is the amount of information that is needed to accurately describe an example of this. So, if the sample is homogeneous, then all the records in which the entropy is 0; otherwise, if the test is a multiple of equal, the larger the entropy is a maximum of 1.
So, on the left of the cup, it is the lowest level of entropy, in the middle of the cup has more entropy, and to the right of the cup with the greatest entropy.
Mathematically written as,
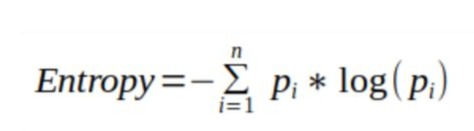
FIG:9
Gini index / Gini impurity
The Gini index is a measure of income inequality. It has a value between 0 and 1. A Gini index value of 0 means that there is a need to be perfectly consistent, not all of the elements are the same, while the Gini index with a value of 1 implies that there exists a maximal inequality among them. This, the sum of the squares estimates in each of the classes. This is because, as described below, the

FIG:10
LOGISTIC REGRESSION
The logistic regression model is a statistical model that in its basic form uses a logistic function to model a double, the dependencies of variables, even though many of the more complex add-ons. In regression analysis, logistic regression is estimating the parameters of a logistic model of the binary regression model for the form).
Showing Varginica from iris data after applying logistic regression:

FIG:11
Support Vector Machine
SVM is one of the most popular and versatile machine learning algorithms. It is widely used for classification problems, for regression problems. However, on this subject, let's talk about the classification of the trouble. It is generally the preferred choice for medium-sized to small data set sizes. The main task of the SVM is to find the optimal hyperplane, the line that divides the data points of the components, and the two terms of the highest profit margin.

FIG:12
GitHub Code:
https://github.com/namartagocher/malaria_prediction
References:
https://eu.biogents.com/malaria/
https://www.sciencedirect.com/science/article/abs/pii/S0010482520304820?dgcid=rss_sd_all
Comments