Author : Aditya
Multivariate Adaptive Regression Splines belongs to the group of regression algorithms which are mainly used to predict numerical variables. It is the part of supervised machine learning which uses labeled data to build the relationship between data inputs and outputs.
Category of algorithm in which MARS belong.
Working of MARS algorithm.
Building a prediction model in Python using MARS.
Category of algos in which MARS belong:
Category of algos in which MARS belongs to the group of regression algorithms which are mainly used to predict numerical variables. It is the part of supervised machine learning which uses labeled data to build the relationship between data inputs and outputs.

Figure-1
Working of MARS algorithm:
Simple linear regression can’t always give a good approximation of outputs as the real world is often non-linear, so for better results MARS is used. MARS can be assumed as of linear functions joined together by some hinge functions. For better understanding of combining linear hinge functions can be seen in figure below, in which red line is predicted by MARS model:

Figure-2
Here we can observe that it is not possible to draw one straight line across the whole set of observations (black dots).
The MARS algorithm works on two different stages:
The forward stage.
The backward stage.
In forward stage, many candidate basis functions are produced in pairs h(x-c) and h(c-x). If the generated pair of function reduces the overall model’s error then it is added to the model. Hence, the number of functions generated with a hyper parameter can be controlled. In backward stage, it goes through functions and inspects one at a time and deletes the functions which add no material performance to model. The result comes in form of several linear functions which we can write in a simple equation. Here, for the above example equation can be written as
Y= -14.39 + 1.99*max(0, 4.33-x) + 2.009*max(0, x+9.95)
Building a prediction model in Python:
We will use the following:
House price data.
py-earth library to build MARS models.
Plotly library for visualizations.
Pandas and Numpy.
Here we can see the 3D plot, the relationship between the variables-

Figure-3
Here we can observe that it is not possible to draw one straight line across the whole set of observations (black dots).
The MARS algorithm works on two different stages:
The forward stage
The backward stage
In forward stage, many candidate basis functions are produced in pairs h(x-c) and h(c-x). If the generated pair of function reduces the overall model’s error then it is added to the model. Hence, the number of functions generated with a hyper parameter can be controlled. In backward stage, it goes through functions and inspects one at a time and deletes the functions which add no material performance to model. The result comes in form of several linear functions which we can write in a simple equation. Here, for the above example equation can be written as
Y= -14.39 + 1.99*max(0, 4.33-x) + 2.009*max(0, x+9.95)
Building a prediction model in Python:
We will use the following:
House price data
py-earth library to build MARS models
Plotly library for visualizations
Pandas and Numpy
Here we can see the 3D plot, the relationship between the variables-
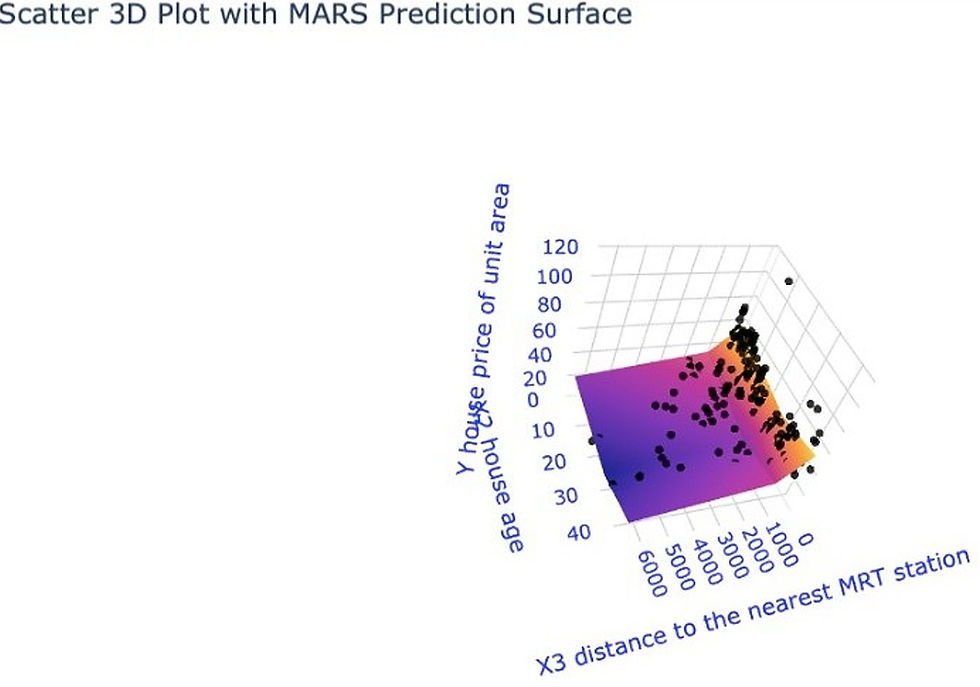
Figure-4
For better visualization, you may run the code given in the Below GitHub link.
Comments