Author: yeshwanth buggaveeti
PCA is one of the famous technique in exploratory data analysis and Data-preprocessing for predictive models. Data is the new oil in this world, as we are making data much expensive, we also expect it to be perfect. To make Data accurate, we will be performing pre-processing methods like 1) Data cleaning 2) Data integration/aggregation 3) Data transformation 4) Data reduction. Principle component analysis will come under Data reduction; Data reduction is a process that reduces the size of data and makes it suitable for analysis. In this process, the integrity of the data must be preserved and data volume is reduced. Many techniques can be used for data reduction. (Principle component analysis) Dimensionality reduction is one of them. Now we will dive into the topic.

Principal Component Analysis (PCA) is nothing but a dimensionality reduction method, is used to reduce the dimensions of heavy datasets into fewer dimensions; by using the principle components we will select few variables of a data set and making the dataset smaller without losing the integrity of the data. at last, we will get a new dataset for analysis. PCA is also used in the feature selection of time series data, where we will be using the decomposition of data with the help of PCA for selecting the right features and feature selection is widely used in computer vision, pattern recognition and machine learning. In smaller datasets, we can find good insights and it is easy to visualize.
The Flowchart of PCA is:

Processes Involved in PCA:
1)Data Standardization/Normalization:
This process is from data transformation and it is performed before the PCA for example, if the dataset is normalized and we perform PCA on it, we will have a chance of getting low errors, if standardization is not performed we will get a high amount of errors.
Normalization is used to measure the data of an attribute so that it falls in a smaller range, such as -1.0 to 1.0 or 0.0 to 1.0. It is generally useful for classification algorithms. Methods in Data Normalization are Log Scaling, Min-Max Normalization and Z-Score Normalization. Each of the three methods has different formulas for normalizing the data.
The mathematical formulas are:
Log Scaling: x' = log(x)
Z-Score: x' = (x{value} – μ{mean}) / σ{standard deviation}
Min-Max Normalization:
x' = [X – X(min) / X(max) – X(min)] * (new X(max) – new X(min)) + new X(min)
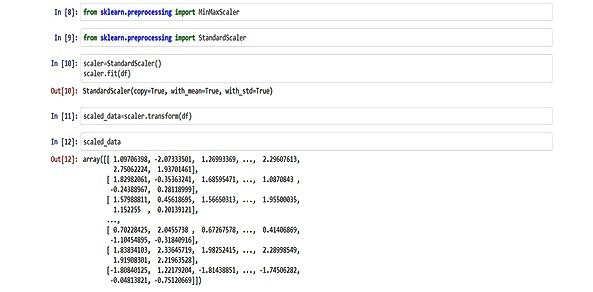
By the above code, we converted the dataset values between 0 to 1 and we returned the normalized values in the array format.
The sklearn.preprocessing library is used to import Normalization methods. Transform() function is used to transform the normalized values.
2)Calculation of Covariance/Correlation Matrix:
To find out the covariance matrix, first, we need to know the use of the covariance matrix. It is used to calculate the correlation between the variables from the centered mean. And also if the variable of an input dataset is highly related, it will lead to the repetition values in the dataset.
The covariance matrix is N*N symmetric matrix where, N is the dimensions of the matrix, usually 2*2 will be the size/dimension of the covariance matrix. Covariance of a variable itself can be defined as [Cov (x,x) = covariance of variable x] and it is also satisfied with commutative property [Cov(x,y) =Cov(y,x)]. If Covariance is positive then the variables will increase or decrease together however if the covariance is negative then the variables will be inversely related(if one decreases then the other increases).
Note: in python, we can calculate the correlation between the variables with the help of Heatmap and covariance matrix functions. These functions are available at seaborn's and NumPy libraries.
import numpy as np
mean_vec = np.mean(X_std, axis=0)
cov_mat = (X_std - mean_vec).T.dot((X_std - mean_vec)) /(X_std.shape[0]-1)
print('Covariance matrix \n%s' %cov_mat)
The above code will print the covariance matrix, the sample picture of covariance matrix and formula for calculating the covariance of variables are shown in below image.
Formula for calculating covariance of a variable “x” is given below.

Where,
N is the number of sample
‘Xi/j' is the mean of x and y variables.
Covariance matrix for 2 dimension data:

Sample:

where, “-ve” shows negative correlation and positive sign shows positive correlation.
Similar we calculate the covariance for the other variables in the matrix using the same formula of covariance.
3)Calculation of eigenvectors and eigenvalues from covariance matrix (creating new dataset):
Eigenvectors and eigenvalues are the concepts related to linear algebra (generally represented between x and y-axis) with the help of these two we will find out the principle components from the dataset. Eigenvectors and eigenvalues used to define the directions and magnitude of the principal components. The principle components are constructed based on linear combinations of the initial variables.
The total variance is the sum of variances of all individual principal components. The fraction of variance explained by a principal component is the ratio between the variance of that principal component and the total variance. For several principal components, add up their variances and divide by the total variance.
For example,
Let’s suppose that our data set is 2-dimensional with 2 variables x,y and that the eigenvectors and eigenvalues of the covariance matrix are as follows:

If we rank the eigenvalues in descending order, we get λ1>λ2, which means that the eigenvector that corresponds for the first principal component (PC1) is v1 and the one that corresponds to the second component (PC2) isv2.
After having the principal components, to compute the percentage of variance (information) accounted for by each component, we divide the eigenvalue of each component by the sum of eigenvalues. If we apply this to the example above, we find that PC1 and PC2 carry respectively 96% and 4% of the variance of the data.
1) Eigen value:

by this formula we will calculate the eigen values and we get eigen values as λ1,λ2 and etc.
2) Eigen vector for " λ1" Eigen value:

Where, "λ1” is eigen value, “U” is eigen vector and “I” is identity matrix

Note: for calculation of λ1,λ2 eigen values, we will use √(b^2-4ac)/2a to get roots of eigen equation / quadratic equation.
"λ1” will be first principle component and "λ2” will be second principle component.
From the two formulas in the above image, we will calculate the linear/Eigen equation from that equation we will calculate the roots called eigenvalues(principal component 1 & 2) after we will do the same to calculate the Eigen vector-matrix. After we will normalize the Eigen vector-matrix for principal component 1 & 2. Finally, we will derive a new dataset from these values.

Here, p.c1 and are same
Where,

is the transpose of the normalized eigen vector
In other words,

Note: The Feature Vector and e transpose are the same. Standardized Original Dataset is the normal value of x – mean of x.
The e transpose(unit Eigenvector) is the transpose of eigenvector-matrix of principle component-1, Like this, we will calculate the pc2, pc3 and pc4 all these principal components are calculated in this format to construct a final dataset with low dimensions and good integrity.
In python, the eigendecomposition of the covariance matrix (if the input data was standardized) yields the same results as an eigendecomposition on the correlation matrix, since the correlation matrix can be understood as the normalized covariance matrix.
Eigendecomposition of the standardized data based on the correlation matrix:
cor_mat1 = np.corrcoef(X_std.T)
eig_vals, eig_vecs = np.linalg.eig(cor_mat1)
print('Eigenvectors \n%s' %eig_vecs)
print('\nEigenvalues \n%s' %eig_vals
the above code will print all the eigen values and vectors for any dataset.
GitHub:
https://github.com/krishnaik06/Principle-Component-Analysis/blob/master/PCA.ipynb
References:
https://builtin.com/data-science/step-step-explanation-principal-component-analysis
https://www.geeksforgeeks.org/ml-principal-component-analysispca/
https://machinelearningmastery.com/calculate-principal-component-analysis-scratch-python/
Comments